

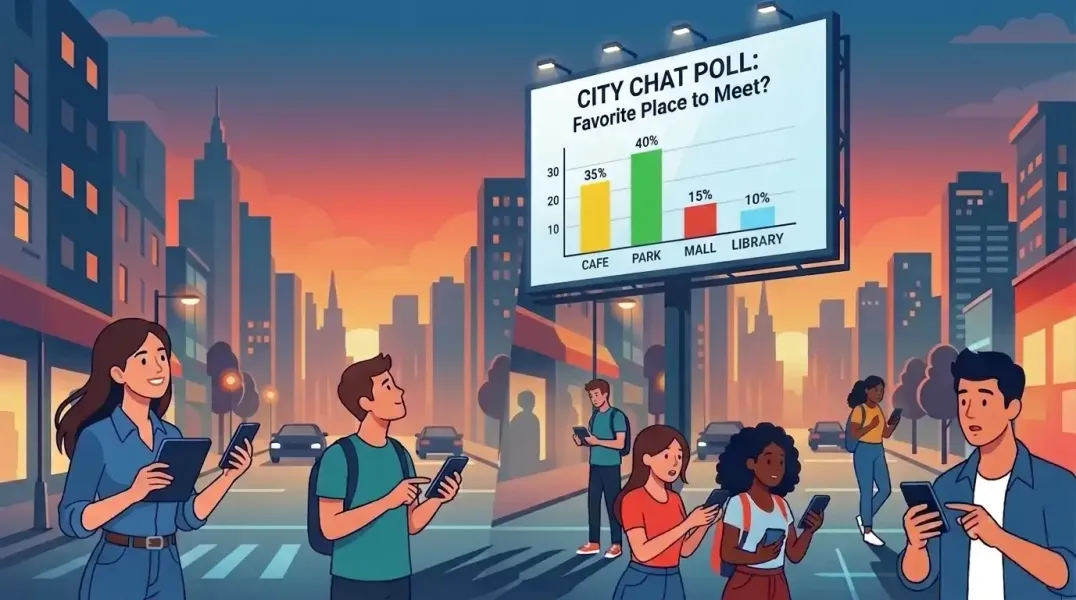
Surveys are one of those things everyone means to do after an event but rarely gets around to. A separate link, a separate tool, a reminder email nobody opens. We wanted to fix that. Starting today, you can add survey challenges directly inside any Thrillify event. Players answer them right alongside the rest of the challenges, earn points for participating, and results stream in live.
But surveys aren’t just for “how was the event?” feedback. They can be part of the event itself.
More Than Post-Event Feedback
The most interesting thing about embedding surveys inside an active event is that you can ask about anything happening around you, not just the event logistics. Think of surveys as a way to get the crowd’s take on whatever is going on in the moment.
At a conference or summit, ask attendees to vote on their favorite keynote speaker, rank the breakout sessions they attended, or rate the lunch options. When hundreds of people answer at once and results update live on a projected screen, it turns a passive audience into active participants.
At a company offsite, let teams rank the icebreaker games from best to worst, vote on which team had the best costume or skit, or rate each workshop on a 1-to-10 scale. The instant feedback gives facilitators something concrete to work with for next time.
At a convention or fan event, run polls like “Which cosplay deserves best in show?”, “Rank the panels you attended today”, or “What’s the one thing you’d add to next year’s event?” Conventions are full of opinions, and surveys give people a fun way to share them.
At a wedding or party, ask guests to vote on the best dance move, rank the appetizers, or submit their favorite memory with the couple. Show the word cloud on a screen during the reception and watch the room react.
At a school field day or campus event, let students pick their favorite activity, rate the food trucks, or vote on which team had the best spirit. Surveys keep energy high between challenges and give organizers data they can actually use for planning next year.
The point is: surveys work best when they feel like part of the fun, not homework.
A Question Type for Every Situation
Thrillify survey challenges support seven question types so you can match the format to what you are asking.
Single Choice is perfect when you want one clear answer from each person. “Which keynote was your favorite?” or “What should we do for the final activity?”
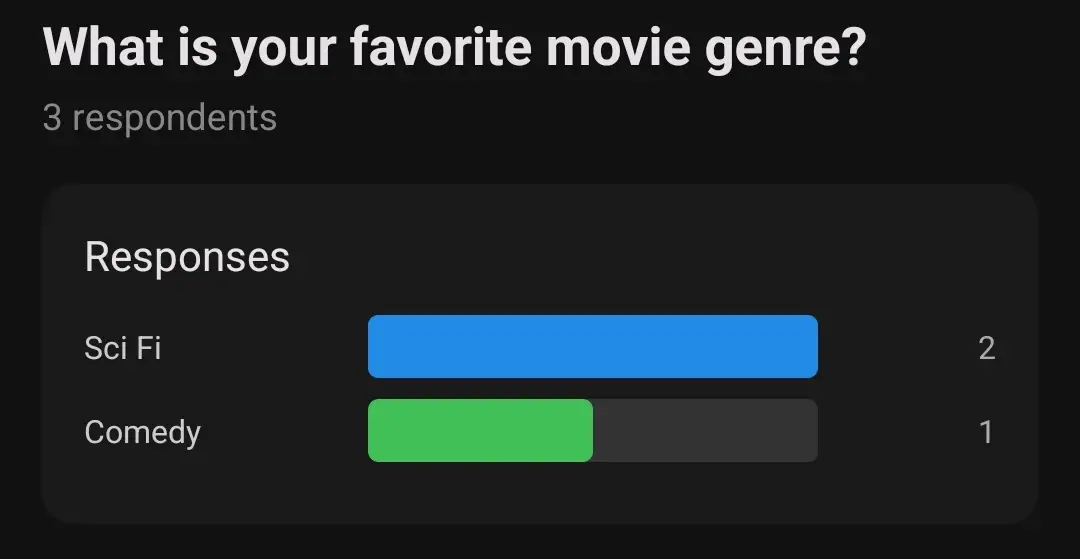
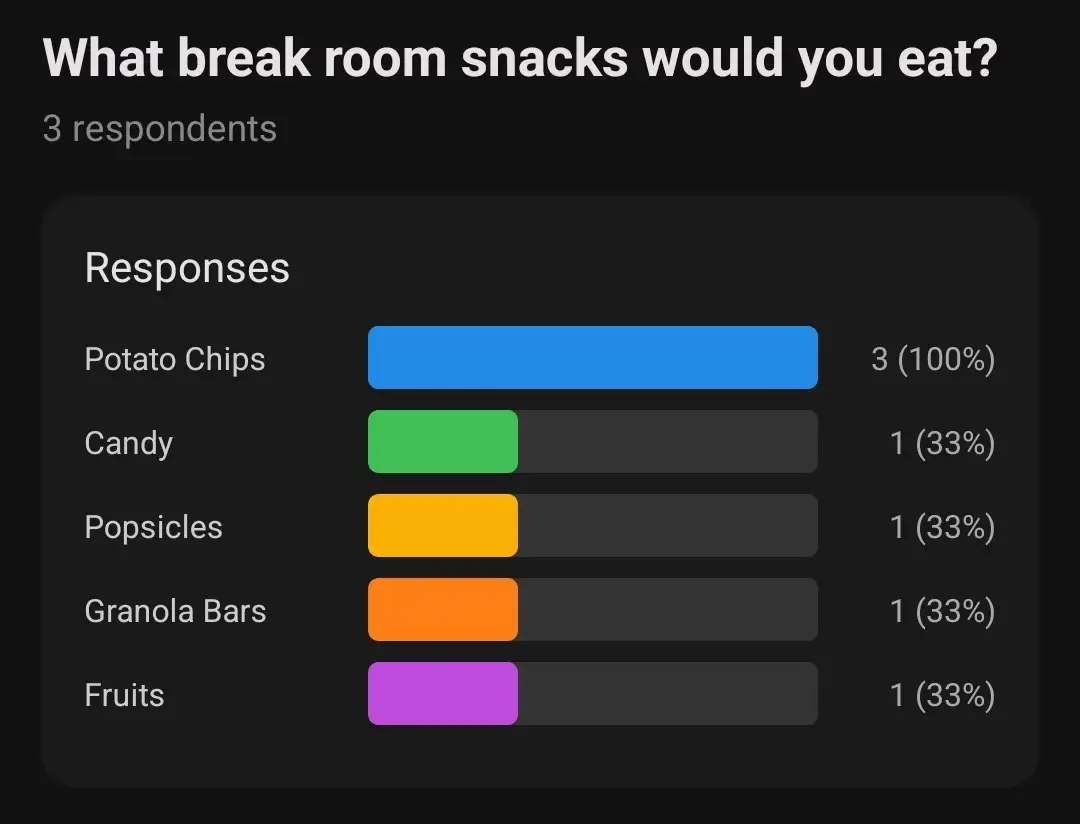
Multiple Choice lets players select more than one option. “Which activities did your team complete today?” or “Check all the food stations you visited.”
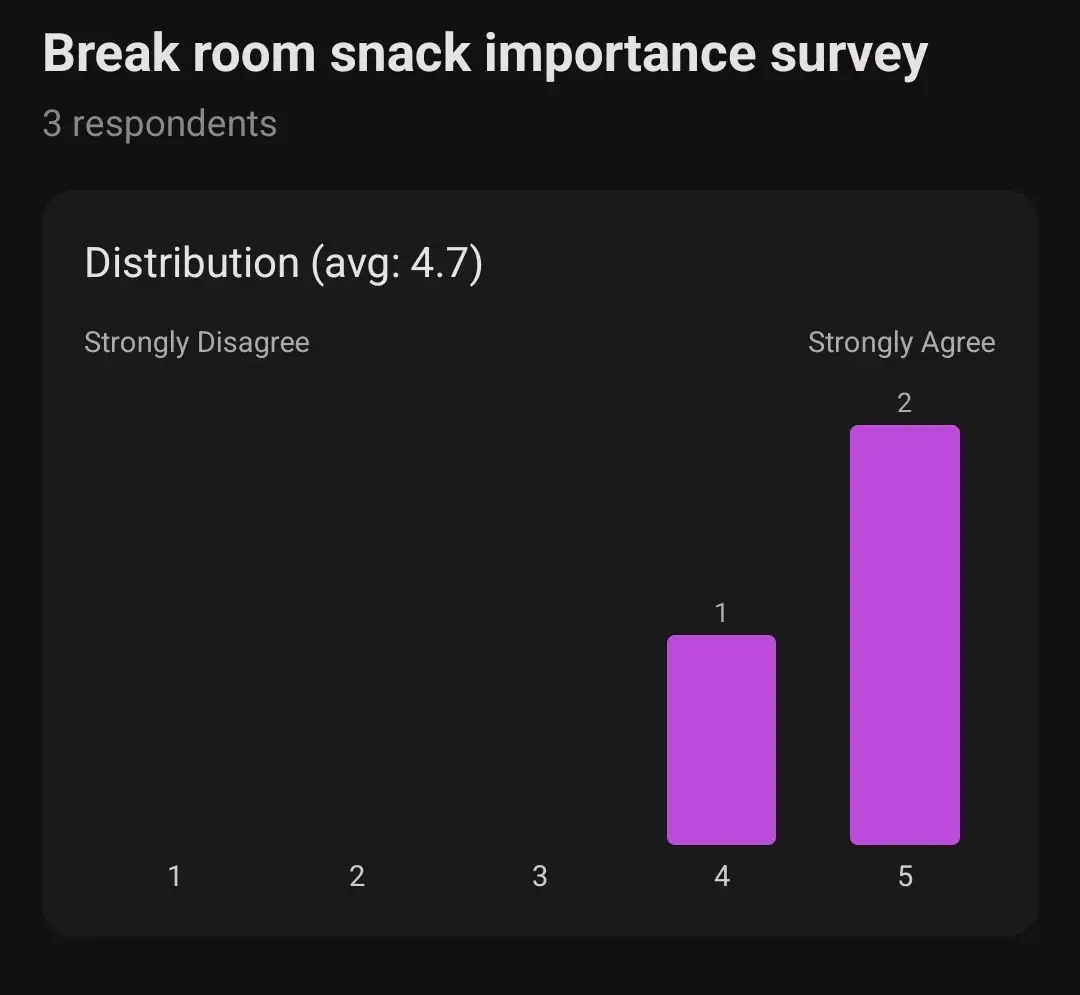
Rating gives you a numeric scale (1 to 5 or 1 to 10) and shows the full distribution of responses, not just an average. Great for “Rate today’s workshop” or “How energized are you right now?”
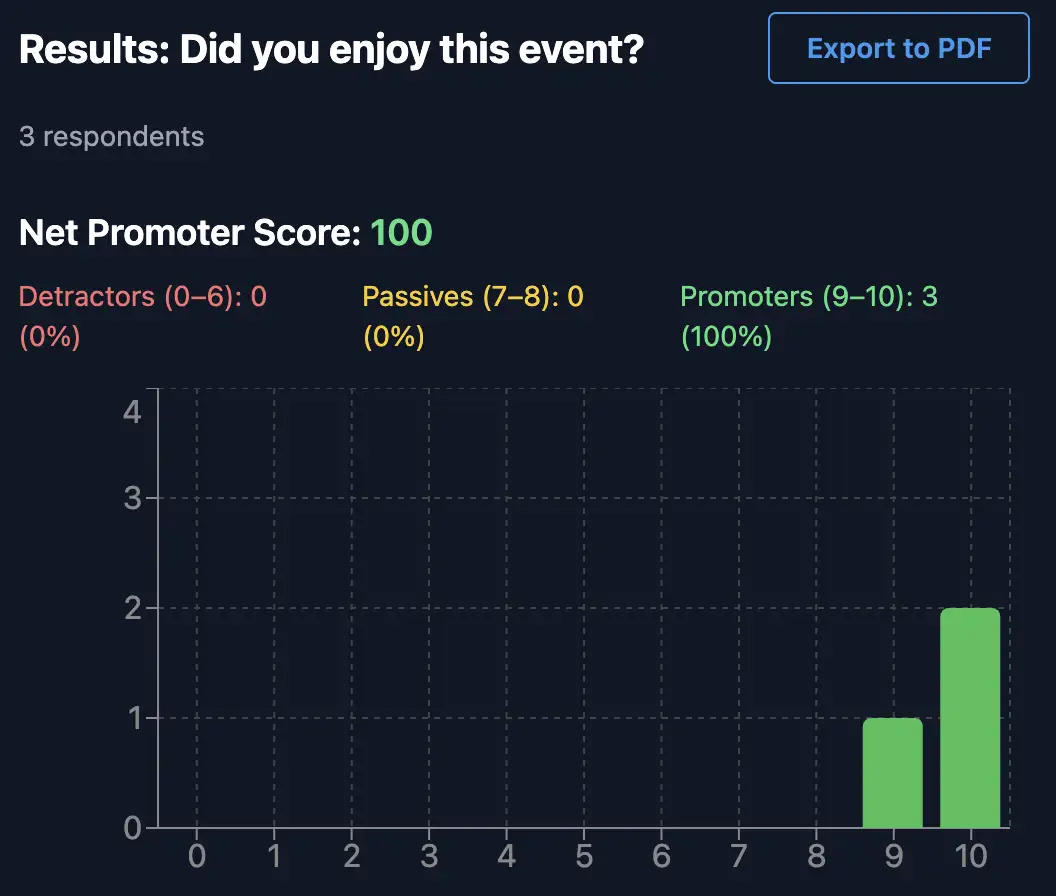
Net Promoter Score (NPS) is the classic 0-to-10 recommendation scale. “How likely are you to recommend this event to a friend?” It automatically groups responses into promoters, passives, and detractors so you can track event quality over time.
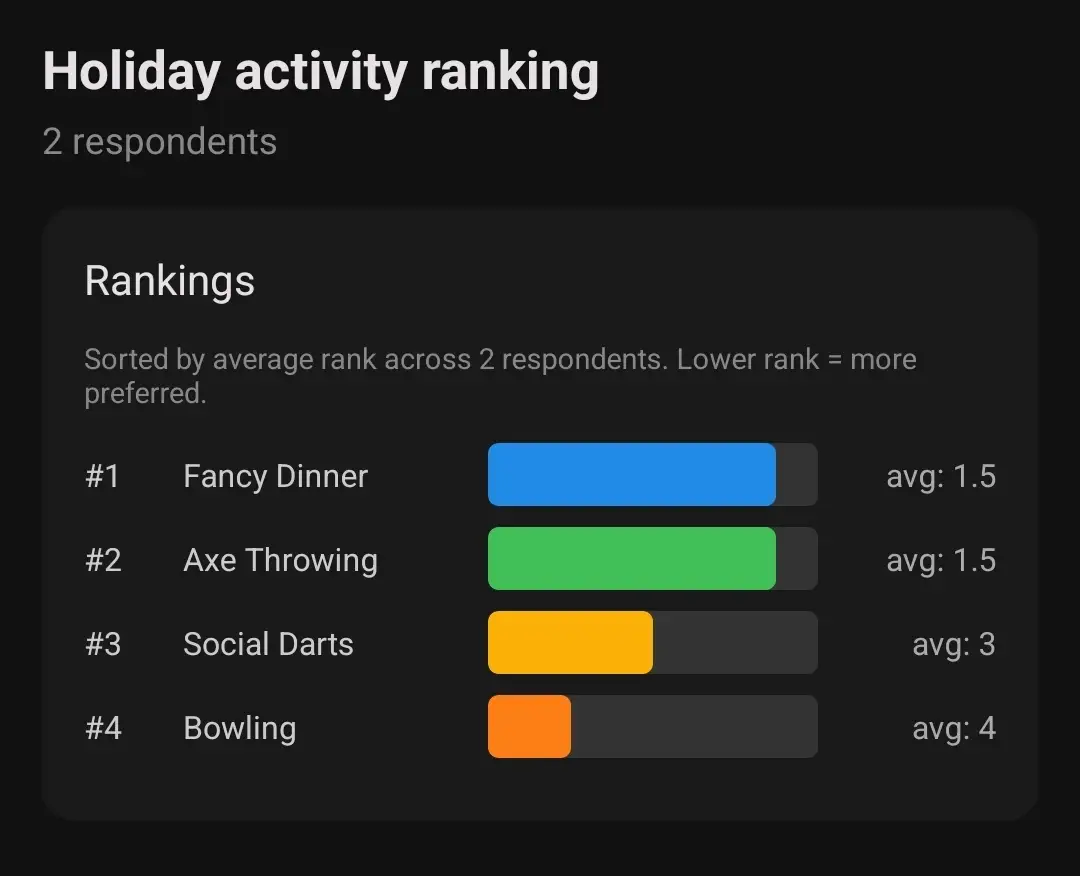
Ranking asks players to drag items into their preferred order, and the results show the crowd’s overall ranking. “Rank the team presentations from your favorite to least favorite” or “Put these icebreakers in order of how much you enjoyed them.”
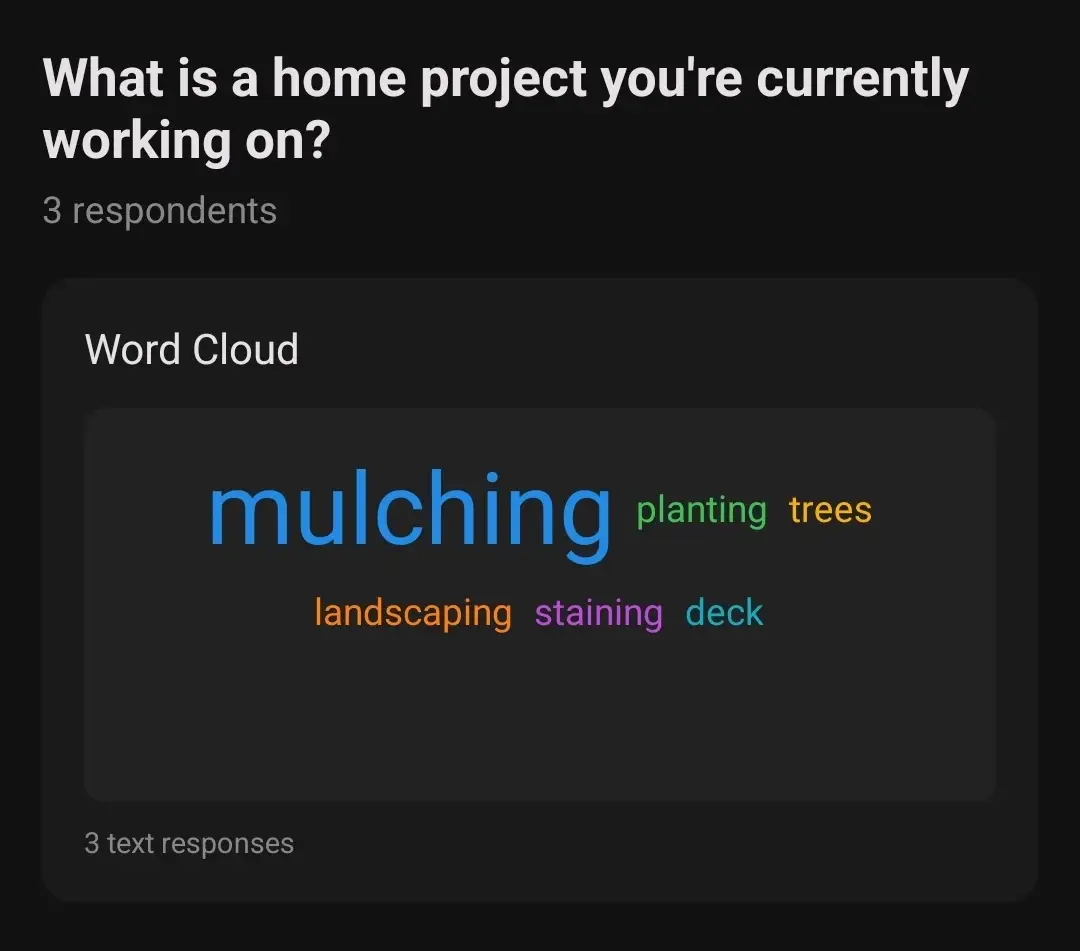
Short Text and Long Text let players write freeform answers. Responses are displayed as a word cloud alongside a list view, which is surprisingly fun to watch fill up in real time. Ask “Describe today’s event in one word” or “What’s one thing you’d change about next year?”
Turn on Live Results and Watch the Room Light Up
One of the best parts of survey challenges is the option to make results visible to everyone in real time. When you enable live results, every player can see the aggregated, anonymized responses update as more people submit their answers.
This opens up all kinds of engaging moments:
- Project the results screen during a debrief. As the last few responses trickle in, the bar chart shifts and the crowd reacts. It is a simple way to turn a standard wrap-up into something interactive.
- Run a live poll to make a group decision. “Should we extend the challenge window by 30 minutes or move on to the awards ceremony?” Let the audience decide and show the results in real time.
- Build suspense with a ranking question. “Which team had the best performance?” Watch the leaderboard shuffle as votes come in.
- Use a word cloud as a conversation starter. Ask everyone “What’s one word that describes today?” and display the growing word cloud on a big screen. Common themes emerge quickly and the visual is always a crowd-pleaser.
- Compare ratings across sessions. If you run a rating survey after each activity block, you can pull up the results side by side during the closing remarks to see which one the group liked best.
If you would rather keep results private, you can set them to hidden. Only event admins will see the data in the Backstage portal. This is useful for more sensitive feedback, like rating a facilitator or collecting honest suggestions. You can always reveal the results later on your own terms.
Use Surveys to Improve Future Events
Beyond the in-the-moment fun, surveys give you lasting data. Every response is saved and available in Backstage after the event ends.
You can export results to PDF for a shareable report with all the charts and visualizations, perfect for sending to stakeholders, sponsors, or your planning committee. You can also download the raw submission data for deeper analysis.
Over multiple events, this data starts to tell a story. You can compare NPS scores across quarters, track whether satisfaction with specific activity types goes up or down, and identify patterns in the open-text suggestions. Instead of guessing what worked, you have numbers and quotes to back it up.
A few ways organizers are already using this:
- Tracking NPS after every quarterly team event to measure whether engagement is trending up
- Comparing rating distributions for different workshop formats to find what resonates
- Pulling word cloud themes into planning docs for the next event
- Sharing PDF exports with leadership to demonstrate the impact of team-building investments
Get Started
Survey challenges are available now for all events. Head to the Challenges tab in Thrillify Backstage, choose Survey as the challenge type, and start building your first survey.
For a full walkthrough of every question type, result visualization, and visibility setting, check out our support article: How do I create a survey challenge?